

A social media report filled with reach, impressions, engagement, and follower counts can be difficult to interpret, especially when comparing several months of performance. The numbers are available, but understanding what changed requires looking at them together.
I find that different chart styles make these comparisons much clearer. A line chart explains monthly growth, bar charts reveal differences in engagement, and donut charts show how traffic is distributed across platforms.
chartgpt.co makes creating these visuals straightforward. It accepts numerical data and written chart instructions, then converts them into downloadable visualizations. This guide demonstrates how to prepare social media reporting data, select appropriate chart styles, interpret the figures, and use the finished charts in reports and posts.
Getting Started With chartgpt.co
The chartgpt.co homepage has a simple layout. The main input field is labeled "Describe the chart you want," with a Generate chart button directly beneath it. Rather than opening a spreadsheet-style editor, the tool asks for the numbers and a description of how they should be presented.
It supports nine chart styles, including bar, line, area, horizontal bar, grouped bar, stacked bar, scatter, pie, and donut charts. For reporting, I prefer starting with the metric I want to explain and then choosing the visualization. A monthly trend needs a different presentation from a comparison of individual content formats.
The basic workflow is to paste the relevant figures, specify the chart style and title, and click Generate chart. The visualization appears in the preview area, with controls for switching chart types or exporting the result.
One useful feature is the chart-type selector. Switching between the available styles redraws the existing data without another generation. However, changing the chart title, sort order, units, or included values requires revising the written instruction and generating again.
Preparing My Reporting Data
To keep the comparisons consistent, I organized six months of sample Instagram performance data into a spreadsheet. The figures below are illustrative reporting data used throughout this walkthrough, not verified analytics from a live Instagram account.
| Month | Reach | Engagements | Followers |
| January | 18,500 | 920 | 2,400 |
| February | 22,300 | 1,150 | 2,580 |
| March | 27,600 | 1,420 | 2,810 |
| April | 25,100 | 1,310 | 3,020 |
| May | 34,800 | 1,890 | 3,380 |
| June | 41,200 | 2,260 | 3,790 |
I kept reach, engagements, and follower counts in separate columns because each answers a different reporting question. The dataset already contains some interesting differences. Reach declined during April, while the follower count continued increasing. Engagements also grew considerably between January and June, but that does not automatically indicate a similar improvement in engagement rate.
These are the details I want the charts to make visible. Before using actual Instagram data, I would check for missing months, inconsistent date ranges, and differences between reach and impressions. The spreadsheet should remain the source of record even after the charts have been exported.
Line Chart for Reach
The first visualization I selected for the reporting exercise is a line chart. It is the most appropriate way to show how Instagram reach changed across six consecutive months.
I used the Month and Reach columns and specified a line chart titled "Instagram Reach Over Six Months," with months along the horizontal axis and accounts reached on the vertical axis.
The data starts at 18,500 in January, increases to 27,600 in March, declines to 25,100 in April, and finishes at 41,200 in June.
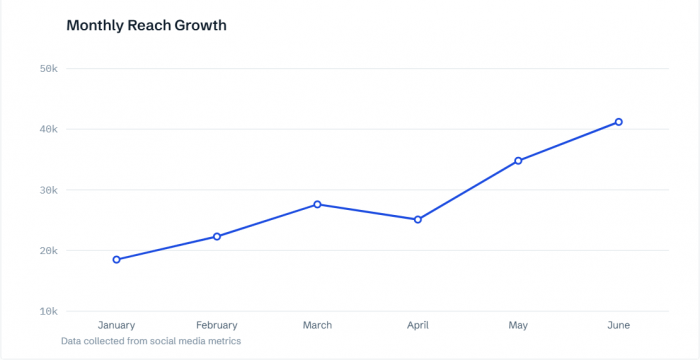
Figure : Line chart showing monthly Instagram reach, including the April decline and subsequent recovery.
What the Chart Reveals
The main finding is that reach increased by approximately 122.7% between January and June. However, the trend was not continuous. April recorded a 9.1% decline from March before performance recovered during May and June.
This is exactly why I prefer a line chart over a simple comparison of the first and last months. The headline growth figure looks impressive, but the complete timeline reveals an interruption.
For a monthly social media report, I would describe the result as an overall increase in reach with a temporary decline in April. I would then examine the content and campaigns published during that period before making any claims about what caused the change.
Bar Chart for Engagement
After reach, the next metric I wanted to visualize was monthly engagement. I used the engagement values from the same dataset and selected a vertical bar chart titled "Monthly Instagram Engagements."
The six months remain in chronological order, with engagement counts displayed as whole numbers.
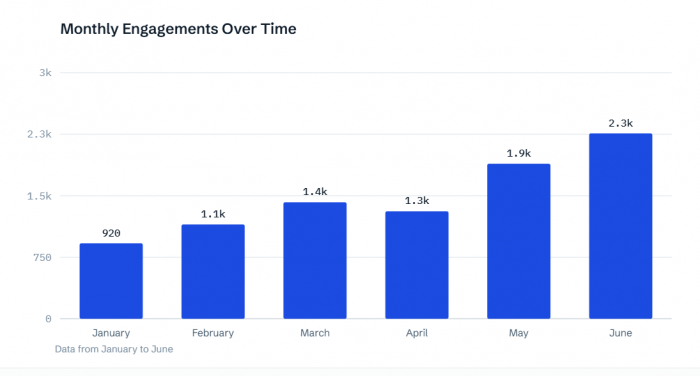
Figure : Monthly engagement comparison, with June recording the highest number of interactions.
What the Chart Reveals
January recorded 920 engagements, while June reached 2,260. That represents an increase of approximately 145.7%. The bars also show the decline between March and April, followed by a stronger increase in May and June.
At first, engagement appears to have grown faster than reach. However, absolute engagement totals do not provide the complete picture. I compared engagements against reach to understand whether the relative level of interaction improved.
January's engagement-to-reach ratio was approximately 4.97%, while June's was 5.49%. The difference is much smaller than the increase in total engagement. This is an important distinction for social media reporting. Higher engagement totals can reflect greater exposure, while engagement relative to reach helps explain how frequently the reached audience interacted. Looking at different engagement signals also helps distinguish passive interactions from actions that indicate stronger audience interest.
A bar chart communicates the monthly counts clearly, while the accompanying analysis provides the context needed to interpret them.
Horizontal Bars for Content Performance
Monthly account performance explains the overall direction, but I also wanted to show how different Instagram content formats compare. For that, I prepared a separate sample dataset containing Reels, carousels, and image posts.
| Content format | Posts published | Total engagements | Average per post |
| Reels | 12 | 7,800 | 650 |
| Carousels | 8 | 6,000 | 750 |
| Image posts | 10 | 3,400 | 340 |
I focused on average engagements per post instead of total engagements because the publishing frequency differed across the three formats. For the chart, I selected horizontal bars, using the values 750 for carousels, 650 for Reels, and 340 for image posts. I arranged the categories from highest to lowest.
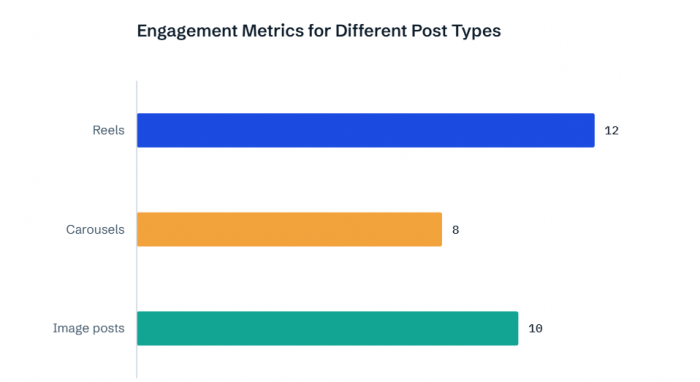
Figure : Carousels rank first for average engagements per post, despite Reels producing more total interactions.
What the Chart Reveals
The ranking changes depending on which metric is used. Reels generated 7,800 total engagements, the highest overall contribution. However, carousels recorded an average of 750 engagements per post compared with 650 for Reels.
That puts carousels approximately 15.4% ahead of Reels in average engagement per post. The horizontal chart makes this comparison easy to read because the format names remain visible and the bars are ranked by performance.
This is a useful finding for content planning. Total engagements explain how much a format contributed to the account, while average engagements help assess individual post performance.
The figures do not establish that carousels are always more effective. A complete decision would also consider reach, conversions, production effort, and the purpose of each format.
Grouped Bars for Interaction Types
I also wanted to distinguish between different kinds of engagement rather than treating every interaction as one number. For that comparison, grouped bar charts are more suitable than a single-series bar chart.
A grouped chart places two or more related measurements beside each content category. This works well for comparing average likes and comments across Reels, carousels, and image posts.
For a reproducible example, use these illustrative per-post averages:
| Format | Average likes | Average comments |
| Reels | 520 | 45 |
| Carousels | 460 | 90 |
| Image posts | 280 | 25 |
I would select the grouped bar style, use content formats as the categories, and assign separate series to likes and comments.
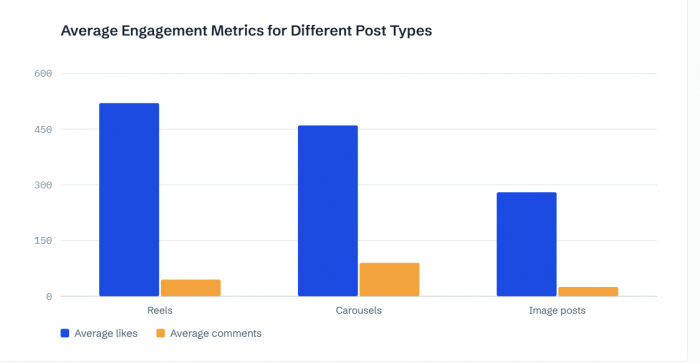
Figure : Grouped bars showing how likes and comments differ across three Instagram content formats.
What the Chart Reveals
Reels lead in average likes with 520, while carousels lead in average comments with 90. This creates a more detailed comparison than an engagement-total chart. The data shows that the format generating the most likes is not necessarily the one generating the most comments.
One limitation is the difference in scale. Likes are much more numerous than comments, so the comment bars appear relatively small. For precise comment rankings, a separate horizontal bar chart would be easier to interpret.
The grouped chart is useful for giving an overview, while individual charts are better when one interaction type requires closer examination.
Donut Chart for Traffic Sources
The next reporting area is website traffic from social platforms. For this comparison, I selected a donut chart because the goal is to show how different sources contribute to one overall total.
The sample dataset contains 10,000 website sessions, divided as follows:
● Instagram contributed 4,500 sessions, representing 45% of the total.
● LinkedIn contributed 2,800 sessions, representing 28%.
● Facebook contributed 1,700 sessions, representing 17%.
● YouTube contributed 1,000 sessions, representing 10%.
I used these four categories in chartgpt.co and selected the donut chart style with percentages displayed for each platform.
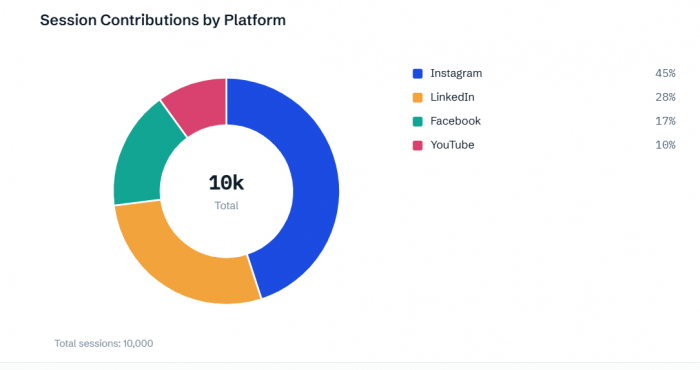
Figure : Donut chart showing Instagram as the largest source of social referral traffic.
What the Chart Reveals
Instagram accounts for nearly half of all the sessions in this dataset. LinkedIn contributes the second-largest share, followed by Facebook and YouTube. The donut chart makes the distribution more immediately understandable than a table of raw session counts.
However, I would not use this chart to explain changes over time. A donut chart shows a snapshot of proportions, not whether traffic increased or declined during the reporting period.
There is also an important data-source distinction. Website sessions should come from a web analytics platform, such as Google Analytics, rather than being calculated from social media impressions or profile visits. The four percentages must add up to 100% because they represent parts of the same total.
Area Chart for Follower Growth
The final chart style I selected for the Instagram performance report is an area chart. It uses the same monthly follower counts from the original dataset, starting at 2,400 in January and reaching 3,790 in June.
An area chart follows the same chronological structure as a line chart but fills the space beneath the data series. I used the title "Instagram Follower Growth" and kept the follower counts as whole numbers.
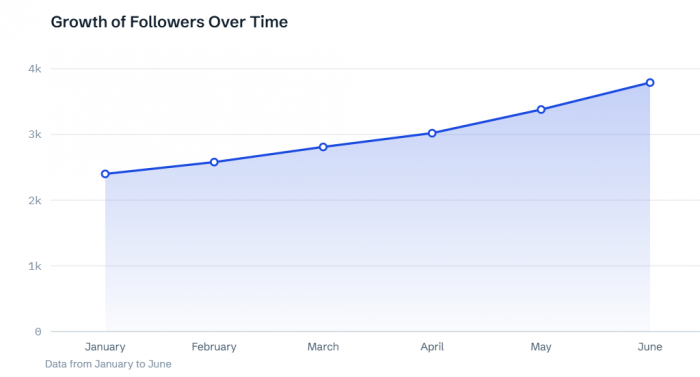
Figure : Area chart illustrating the increase in month-end Instagram followers.
What the Chart Reveals
The follower count increased by 1,390 between the January and June records, representing approximately 57.9% growth relative to January.
Unlike the reach and engagement charts, this dataset contains no monthly decline in the follower total. The strongest consecutive increase occurred between May and June, when followers rose from 3,380 to 3,790.
The area chart emphasizes the growth in total audience size. It is a suitable choice here because the values represent an accumulating follower count. However, these are month-end totals. The 1,390 difference should not be described as the total number of new followers acquired across all six calendar months without knowing the follower count before January.
Comparing the Chart Styles
After working through the different chart types, the main lesson is that the same reporting process does not benefit from using one visualization repeatedly.
Each chart style answers a particular question.
| Chart style | Reporting purpose | Main finding |
| Line | Monthly reach trends | Reach increased 122.7% |
| Vertical bar | Monthly engagement comparison | June recorded 2,260 engagements |
| Horizontal bar | Content format ranking | Carousels averaged 750 engagements |
| Grouped bar | Interaction comparison | Reels led in likes; carousels in comments |
| Donut | Traffic distribution | Instagram contributed 45% |
| Area | Audience growth | Followers increased 57.9% |
For the final report, I would not necessarily include all six visualizations. The selection depends on the reporting objective.
A general Instagram performance report needs reach, engagement, content performance, and follower growth. A campaign-focused report may replace follower growth with campaign results or website traffic.
The point is to use each visualization to explain something different, not to add more charts simply because the tool supports them.
Creating the Final Report
Once the charts are prepared, I would arrange them in a logical reporting sequence.
The reach chart comes first because it establishes how audience exposure changed. The engagement chart follows, showing how interactions developed alongside that reach.
The content-format comparison then explains the relative performance of the published content. Finally, the follower-growth chart provides a broader view of audience development.
Each chart should have a brief written interpretation underneath it. For example, the reach section can explain the overall 122.7% growth and the April decline. The content section can explain why carousels ranked higher by average engagement even though Reels generated more interactions overall.
These explanations are more useful than repeating every figure already displayed in the charts. For exporting, chartgpt.co provides PNG, SVG, and PDF formats. PNG works well in ordinary reports, while SVG remains sharp when resized for presentations.

The platform does not save chart history, so I would export each completed visualization and keep it alongside the original reporting spreadsheet.
Using Charts in Social Posts
The charts can also support social media posts that share performance findings or explain marketing data.
For a LinkedIn post, I would choose the content-performance chart because it communicates a clear comparison without requiring readers to understand the entire reporting dataset.
The finding that carousels recorded 15.4% higher average engagement per post than Reels gives the post a specific focus.
For Instagram, the exported chart can be added to a 1080 × 1350-pixel design with a short headline and a clear source note.
The final graphic should preserve the category names, values, and reporting period. Removing too many labels may make the design look cleaner but also make the comparison harder to understand.
I would keep the public-facing version focused on one finding and use the caption for additional explanation.
The illustrative figures in this walkthrough should be replaced with verified performance data before presenting such findings as real campaign results. chartgpt.co provides the underlying visualization; final branding, captions, and publishing happen separately.
What Works and What Needs Attention
The main appeal of chartgpt.co is that it reduces the amount of manual chart configuration. Instead of building every chart from scratch in spreadsheet software, users can describe the desired comparison and choose from available visualization styles.
Its automatic formatting also helps maintain a consistent appearance across multiple report charts.
However, there are limitations worth considering.
The tool does not directly connect to Instagram, LinkedIn, or YouTube analytics. Reporting data must be collected separately and entered into the chart generator. It also uses automatically selected colors and axis ranges, so detailed branding customization is limited.
Changing chart styles is straightforward, but adjusting titles, sort order, or other instructions requires regenerating the chart.
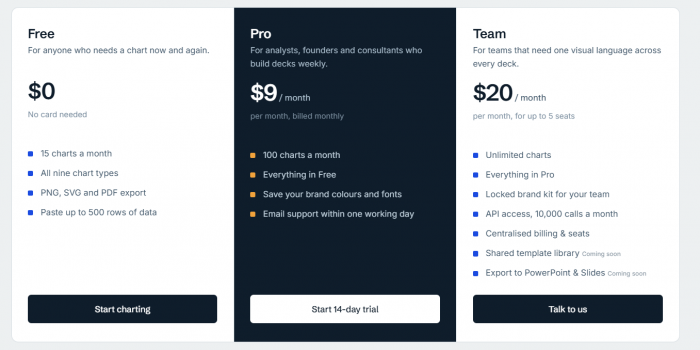
The Free plan includes 15 chart generations per calendar month. Pro costs $9 monthly for 100 generations, while the Team plan starts at $20 monthly for five seats, with unlimited generations subject to fair-use conditions.
For occasional reporting, the free allowance provides access to all nine chart types and the available export formats. The most important consideration is accuracy. A polished chart still requires someone to verify the numbers, calculation methods, labels, and conclusions.
Final Verdict
Using different chart styles makes social media reporting clearer because each one presents a different relationship in the data.
The line chart shows reach trends, vertical bars compare engagement totals, horizontal bars rank content formats, grouped bars separate interaction types, donut charts show traffic distribution, and area charts illustrate follower growth.
What matters most is the connection between the data, the visualization, and the written interpretation. A useful chart should support a specific finding rather than simply make a report look more attractive.
For creators, marketers, and social media managers working with exported performance data, chartgpt.co provides a convenient way to create visuals for reports, presentations, and social media posts without manually building every chart.
Comments